Bond Portfolio Management in a low yield environment
Managing bonds: it's all changed! Once upon a time, you could manage bonds simply by referring to market indices. But historically low interest rates have ravaged the landscape. The methods that worked yesterday have been seriously undermined today, making it even more important to go back to the asset class’s basic principles.
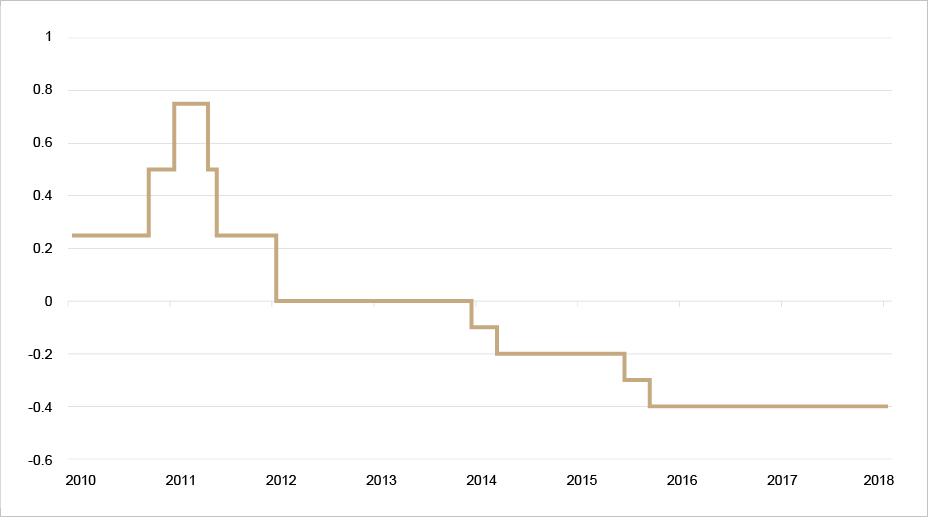
“It’s hard to beat a good old theory,” as my former financial theory tutor, Robert Cobbaut, would say. All bond managers should adopt this dictum. Whereas an equity manager can draw largely on “convictions”, it is maths that rules where bonds are concerned! Managing fixed-income securities obviously involves the notion of interest rate: for the borrower, it represents the cost of finance; for the lender, it is remuneration for the capital locked up; and for the central banker, it is the ultimate tool to manage the economy. At least, that was the case before the collapse of Lehman Brothers. But things have changed since then: with their quantitative easing policies – ‘exceptional’ but nonetheless having a long-term impact – central banks have pushed interest rates down to record lows, creating a real ‘liquidity trap’. According to this Keynesian concept, the remuneration of bonds is so low that people prefer holding cash rather than investing it. The ECB’s deposit facility rate has now been below zero for over four years (Graph 1).
Graph 1 - Deposit facility rate[1]

Source: ECB
This is something of a Copernican Revolution for the bond markets, a paradigm shift, whereby the borrower of last resort is remunerated by the lenders! In the last three decades, yields have been slowly eroded in the leading developed economies, witness the yield on Germany’s 10-year sovereign bond which slumped from around 9.11% to 0.32%. Meanwhile, various regulatory changes have complicated matters. For example, the Volcker Rule in the United States now prohibits banks from trading on their own account.
A new – and uncertain – environment for bond management
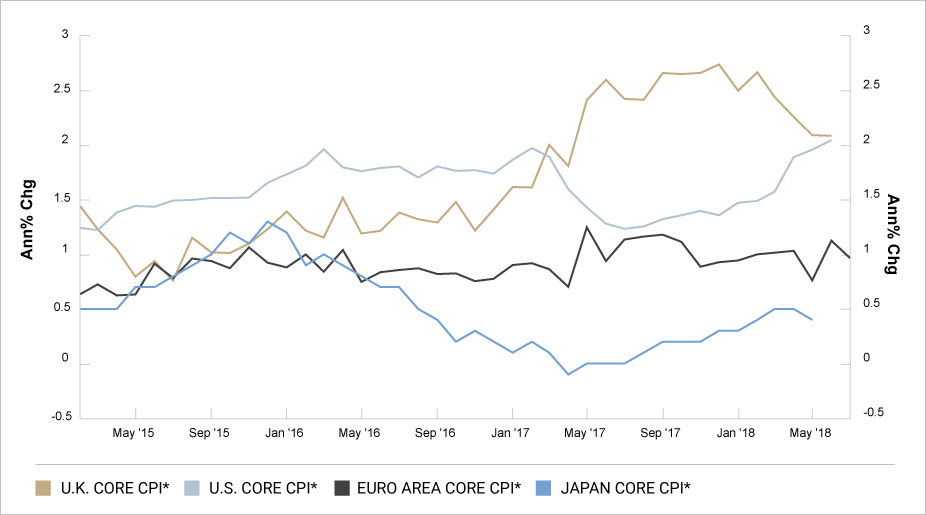
Although the upheaval seems to have been gradual, it has nonetheless resulted in a new theory for investing in bonds, which can no longer be based on a downward trend in yields. The fact is that between June 2016 and June 2018, the US 10-year yield to maturity staged its longest climb for the last 30 years! Inflation, which the central banks are so keen to see return, continues to send mixed signals from one country to another (see Graph 2) and remains a source of concern and hence volatility. And that is precisely why, to find the best way forward and navigate a course through this tempestuous environment without too many jolts, we need to return to bond fundamentals.
Graph 2 - Inflation: contrasting signals

Source: BCA Research
The main concept defining the positioning of a bond portfolio is modified duration. This determines the portfolio’s sensitivity to a change in its yield. It is obtained by calculating the first derivative of the duration function[2] according to the following formula:

Where
D = Macauley's duration
CFt = the cash flow generated by the bond in question at the end of the period t.
r = the interest rate per period (actuarial yield rate required by the market).
T = the number of periods to run to maturity.
It is the sum of the products between the discounted cash flows (expressed as a percentage of the present value of the bond) and their date of receipt.
From this function and taking into account the formula that determines the bond price (C0), we can derive the sensitivity (or modified duration) of the bond, which measures the relative fluctuation of its price for an absolute change in the interest rate of 1% (i.e. 100 basis points):

A simplified version of modified duration could be provided by the following relationship:

Where
m = number of times per year that the coupon is paid
YTM = Yield To Maturity
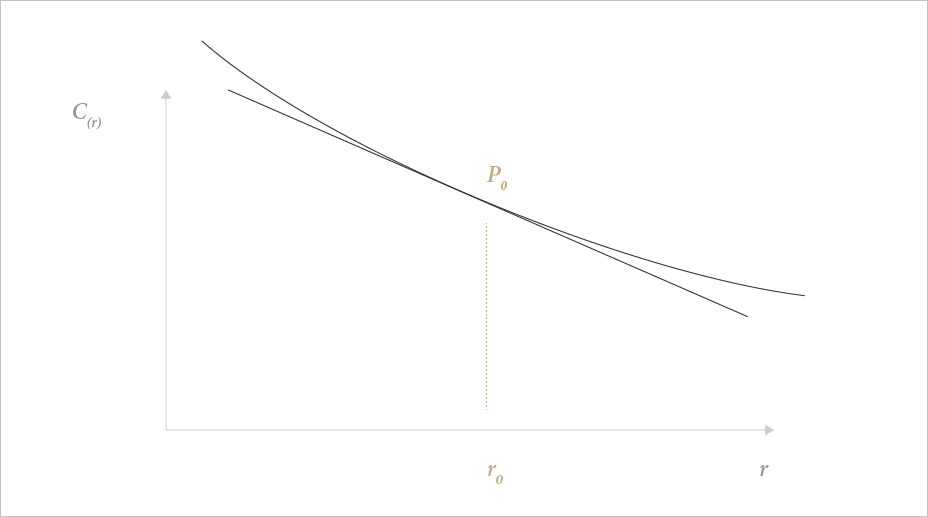
The higher the modified duration, the greater the impact of a change in interest rates on the price: a positive change will reduce the price of the bond and vice versa. It is easy to see why modified duration, which schematically illustrates a portfolio’s level of risk, has become the main tool for the management of bond portfolios. The concern is that this method has lost relevance as interest rates have plunged to the current, extremely low, levels. Modified duration is a good approximation of the sensitivity of a bond price for relatively small changes in yield. However, this relationship is convex, not linear (see Graph 3). The slope of the tangent represents the modified duration of the bond at a given moment. As each pair of coordinates (r, P) has its own tangent, it is clear that sensitivity will change significantly if the yield changes significantly. So, the greater the change in yield, the higher the degree of error in estimating the price will be. This is an important point in the current context of high volatility.
Graph 3 - Bond duration vs price: a convex relationship

Benchmarked management: can past success be replicated?
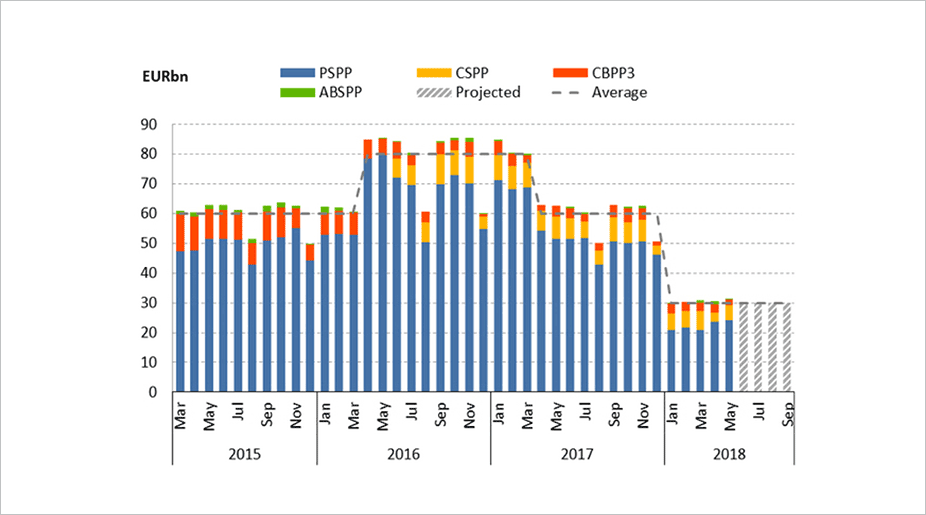
It is no longer sufficient to manage a portfolio solely through the prism of modified duration. This tool to adjust the beta of bond portfolios was highly effective in the 2000s decade. A manager could easily distinguish him/herself without deviating from their benchmark, by good timing when making adjustments: when yields were in the region of 4 to 5%, an increase in modified duration did not overly exacerbate a portfolio's volatility because significant amounts came in from coupons. But today, the sharp decline in yields coupled with ultra-low interest rates has led to an ‘automatic’ increase in the modified duration for a bond with a given maturity (see formula for modified duration above). This can be clearly seen in the leading bond indexes (e.g. the JPMorgan EMU Bond Index): their duration has increased at the same time as yields have been falling, causing a similar movement for benchmarked managers whose portfolios are now extremely sensitive, even to very small variations in yield. This management method also worked well while yields were on a downward trajectory. But everything points to this period being behind us: quantitative easing measures are slowly but surely coming to an end (see graph) and the even longer trend towards an ageing population will be reflected, according to a recent study published by the Bank for International Settlements[3], by a sustainable increase in equilibrium real interest rates[4] in advanced economies. There too, we are seeing a trend reversal compared to the deflationary period following the entry of China and Eastern European countries to the World Trade Organisation, when the influx of new and cheap labour favoured offshoring.
APP monthly net purchases, by programme[6]

Source: ECB
Overcoming classic divides and concentrating on idiosyncratic elements
Today, a well-managed portfolio needs to accord greater weight to financial theory and macroeconomics: convexity, carry, correlations between securities and credit analysis to enable fine discrimination between issuers depending on the quality of their signature. This kind of approach requires distancing yourself from slavishly following indexes and transcending certain barriers, especially between market segments. For bond investors, it is now more necessary than ever to diversify between investment grade and high yield, between sovereign and corporate issuers, between subordinated and unsubordinated debt, rather than having a ‘silo’ vision of these different markets, in order to derive maximum benefit from their breadth and mix. In an increasingly volatile environment, this enables you to look for yield curves whose relative valuation is much more attractive than that of the German bund, and thereby regain the possibility of managing duration in part of your portfolios.
Macroeconomic developments are an essential operational tool for bond managers: from a forward-looking perspective, they must focus on countries demonstrating real dynamism, currently Indonesia or Peru, for example.
Above all, you must get away from the classic divide between developed and emerging markets. Taking the Emirates Telecommunications Group as an example: despite this being an ‘emerging market’ company, its issues in hard currencies are rated AA- at Standard & Poor’s, enough to make any FTSE 100 company green with envy! Evidently, the key defining factor of an issuer’s quality is the nature of its cash flow rather than the location of its head office.
Following on from this, you can cross a sector approach with a regional approach: for example, look at the spread between securities in the Asian telecoms sector and their European counterparts[5] and, through a detailed credit analysis, which is the basis for any conviction in the bond universe, identify market inefficiencies that could be the source of opportunities.
In turning our back on the benchmarks, we can cultivate a freer and more flexible approach. More than ever, bond management needs an enhanced approach, capable of going off the beaten track – or rather the motorway which it has been travelling on for several years. The laws of maths and credit analysis rule OK.
_______________
[1] The interest banks receive for depositing money with the central bank overnight. Since June 2014, this remuneration has switched to being a ‘tax’ on deposits (source: ECB).
[2] According to Macaulay, the best measure of the average duration of a bond must take into account the bond's cash flows (coupons and reimbursement of principal) and the present value of money. Generally, the duration coefficient of a bond can be defined as being the average date on which its holder will receive the cash flows which holding the bond entitles him to.
[3] Demographics will reverse three multi-decade global trends, Charles Goodhart and Manoj Pradhan, 7 August 2017, BIS
[4] Remember that the relationship between nominal and real interest rates can be seen in the following Fisher equation:


i.e. simplifying:

[5] This boils down to questioning the existing structures/divides to give the management greater freedom and fluidity in its risk allocation on a market that has changed radically in the last 30 years: for example, although some Asian issuers are considered as coming from ‘emerging markets’, it is obvious that regions like South Korea or Hong Kong should no longer be considered as such.
[6] APP = Asset Purchase Programmes:
Public sector purchase programme
Corporate sector purchase programme
Asset-backed securities purchase programme
Covered bond purchase programme

